Large Variants and Even Larger Cohorts: Recapping ASHG
We had a blast as ASHG last week, and wanted to thank all the attendees who stopped by our booth. We were delighted to meet you all!
If you couldn’t make it to ASHG, a couple of running themes dominated the sessions and conversations: mega-scale studies, and the evolution of studying variants more complex than SNPs.
It wasn’t so long ago that a 100-person study would have led to an impressive talk at ASHG. But this year, speakers routinely cited studies with tens of thousands, or even hundreds of thousands, of participants. From the Million Veteran Program to the Estonian Biobank, these programs are adding so much to genetic databases that scientists are finally getting a handle on complex hereditary traits such as height. Amid these studies, though, was a continuing push to better represent more ethnic groups to achieve real diversity in publicly available databases. We wholeheartedly support those efforts. Without breaking the barriers of underrepresented groups, we will never achieve precision medicine for everyone.
Another shift came from variant discovery and analysis. More and more, scientists are pushing past SNPs to focus on larger structural variants. The community’s initial focus on SNPs was guided by technology — we could spot single variant changes, so that’s what we looked for — but with improvements to sequencing and other analysis tools using high molecular weight DNA, it is now possible to detect structural variants more comprehensively and reliably. These variants have already been demonstrated to cause diseases, and it was evident at ASHG that finding and cataloging them is a major priority for the genetics field to better understand genome function.
Thanks again for catching up with us in Orlando, and we’re already looking forward to ASHG 2018 in San Diego!
ASHG 2017: Big Studies, Big Names, and Big DNA
We can’t wait for the annual meeting of the American Society of Human Genetics next week! The Sage Science team will be heading to Orlando to catch up on cutting-edge genome science with several thousand of our nearest and dearest in the community.
As always, this year’s ASHG meeting features excellent speakers and sessions. We’re particularly eager for the headline event, a conversation between Francis Collins and Bill Gates that promises to offer interesting perspective on the intersection of global health and genomics. ASHG is also known for its top-tier award presentations. This year we’ll be hearing from recipients such as Kari Stefansson, Art Beaudet, and Dan MacArthur, among others.
Another hallmark of ASHG in recent years is the wealth of posters and talks reporting enormous studies — now regularly thousands or tens of thousands of samples in each — and this year’s agenda continues the trend. We’re eager to learn about new insights into diseases and other phenotypes that have been powered by these mega-scale studies.
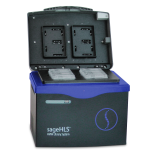
If you’ll be at the meeting, don’t forget to stop by and say hello! We’ll be at booth #752, near the food court. You can check out the new SageHLS instrument for extracting or purifying high molecular weight DNA directly from samples, or learn more about our other automated DNA sizing platforms.
Circulating Tumor DNA Easier to Spot with Size Selection
A bioRxiv preprint from scientists at Cancer Research UK and Cambridge University Hospitals offers a look at how DNA size selection can be used to enhance results of circulating tumor DNA studies. Their analysis indicates that adding a simple sizing step prior to sequencing can provide important insight about tumor genetics from liquid biopsies.
“Selecting Short DNA Fragments In Plasma Improves Detection Of Circulating Tumour DNA” comes from lead author Florent Mouliere, senior author Nitzan Rosenfeld, and collaborators. The researchers note that an ongoing challenge in analyzing ctDNA — an increasingly important marker of cancer progression — is detecting these rare fragments amid a background of much more common cell-free DNA from healthy cells. “In patients with advanced cancers, the median concentration of ctDNA can reach 10% or more of the total cfDNA, but this fraction is much lower in earlier stage cancer, and ctDNA may rapidly decrease following initiation of systemic treatment or surgery,” the authors write. “Recent observations that ctDNA fragments may be shorter than non-tumour cfDNA in plasma has led to suggestions that these differences may be exploited to enrich for the tumour-specific signal in plasma DNA.”
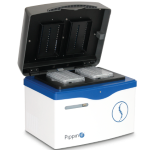
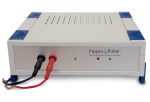
For this project, the team aimed to assess the effectiveness of targeting ctDNA by size in an NGS experimental workflow. Since healthy cell-free DNA is known to peak around 167 bp, the scientists targeted fragments ranging from 90 bp to 150 bp using the PippinHT automated DNA size selection platform. In 26 plasma samples collected from 13 patients with advanced ovarian cancer, the scientists determined that adding a size-selection step “yielded enrichment of mutated DNA fraction of up to 11-fold,” they report. “This allowed identification of adverse copy number alterations, including MYC amplification, otherwise not observed.”
Somatic copy number aberrations (SCNAs) that were detected after size selection, but not in a control workflow lacking size selection, included important cancer-associated genes such as NF1 and PARP2, in addition to MYC. “More SCNAs could be detected after size selection in 11/13 patients, and the absolute level of the log2ratio was significantly increased after size selection,” the authors note.
“These results demonstrate a proof-of-principle that by a simple step of filtering of cfDNA and selection of shorter fragments, it is possible to increase the tumour DNA fraction in plasma cell-free DNA samples,” Mouliere et al. conclude, noting that their approach could work with any downstream NGS analysis method. “The compatibility of the cfDNA fragment size selection with wide-scale and sensitive genomic analysis could unlock the potential of liquid biopsies for the diagnosis of cancer at an earlier stage, and for the detection of minimal residual disease.”
Poster: Gauging Repeat Expansion Size Quickly for Clinical Use
Patients with hereditary ALS-FTLD (Lou Gehrig’s disease, marked by frontotemporal lobar degeneration) typically have a hexanucleotide repeat expansion in C9orf72. The size of that repeat expansion can be indicative of age of onset, severity of symptoms, and more, so it’s an important clinical diagnostic tool.
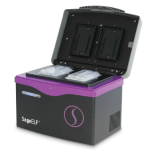
The Sage Science team worked with collaborators at the New York Genome Center to develop and evaluate a simple system for characterizing a person’s repeat expansion length. Unaffected individuals have fewer than 25 repeats, while ALS-FTLD patients might have hundreds or thousands. To gauge the repeat expansion size, we used restriction enzymes to select the genomic region for analysis. That sample was then loaded into the SageELF, which automatically generates 12 consecutive size fractions using gel electrophoresis.
After that process, we used qPCR to identify the size fractions containing the repeat expansion region. The size of the repeat expansion is determined by the size range of the fraction in which it was collected. Since the idea is to eventually deploy this kind of approach for clinical use, an important factor is that the assay can be completed in a single day. We could imagine clinical labs using this method for a quick scan, and following up with deeper analysis techniques for people identified as at risk.
This work was presented recently at the AGBT Precision Health meeting in a poster entitled “A Simple Screening Assay for C9orf72 ALS Repeat Expansions.” As we noted there, “Our assay combines the benefits of Southern blotting for RE sizing, with the sensitivity of PCR, without the need to amplify through the repetitive 100% GC-rich repeat region.” For more information, check out our app note.
This method could be used for repeat expansions of other sizes as well, making it a good fit for diseases like fragile X syndrome, Huntington’s disease, various ataxias, and more.
It’s Baaack! Festival of Genomics Returns to Beantown
It’s time for a genomics party! The Festival of Genomics returns to Boston next week, and we’re already looking forward to it. Sage is proud to be a sponsor and exhibitor at this great event, which brings together more than 1,000 people to share the latest in great science and clinical impact.
The agenda is jam-packed with great speakers, and we’re delighted to see that this year’s event includes a whole track for rare disease patients. General sessions will cover large-scale initiatives — such as organizing 100,000 human genome assemblies, building a human cell atlas, and improving diversity in population studies — as well as relevant drug discovery efforts, CRISPR/Cas9 advances, oncology studies, and much more. We are particularly eager to hear from Zivana Tezak, who will speak about the FDA’s precision medicine strategy.
As always, there will be lots of opportunities to hear about how various technologies are being deployed to improve scientific results. To learn more about automated DNA size selection and how it can make a difference in your lab, check out our booth near Horizon Stage 2. We hope to see you there!
